The Wind Myth: Wind and Runway Selection at Toronto Pearson
- For years, residents were told that runway selection at Toronto Pearson is driven primarily by wind.
- When this claim was challenged with official surface wind data from Environment & Climate Change Canada, the explanation shifted to “winds aloft.”
- At the September 4, 2025 meeting, NAV CANADA stated on the record that winds-aloft data are not published and could not be made available for public verification.
- This statement is incorrect: winds aloft for Toronto Pearson are routinely published through standard aviation weather products used daily for flight planning and do not govern runway crosswind or tailwind limits for takeoff and landing.
- In the same meeting, officials acknowledged that runway use is also driven by operational efficiency and infrastructure layout, including the fact that east–west runways are used more than 95% of the time.
- This page documents that exchange and presents verifiable surface wind data so the public can assess whether “wind” is being used as a genuine safety constraint or as a blanket justification.
Primary records and full wind datasets referenced on this page are linked below.
Records-based note: All statements on this page rely on published aviation standards, official meteorological data, and statements recorded at the September 4, 2025 community meeting.
What Residents Were Told
At a community meeting on September 4, 2025, GTAA and NAV CANADA representatives repeatedly stated that wind direction is the primary driver of runway selection, emphasizing that aircraft take off and land into the wind.
This explanation has been consistently presented to affected communities for years as the reason runway use — and resulting noise concentration — cannot be changed.
The Accountability Question
If wind is the primary driver, then a simple question follows:
What wind data are being used, and can the public verify that those conditions actually require the runway configurations being imposed?
To answer that, residents turned to the official surface weather station at Toronto Pearson, operated under federal meteorological standards.
What the Official Surface Wind Data Shows
Surface wind — the wind relevant to takeoff and landing crosswind limits — is measured using anemometers installed at approximately 10 metres (≈33 feet) above ground, in accordance with international and Canadian aviation-meteorological standards.
Using hourly surface wind data from Environment & Climate Change Canada for Toronto Pearson:
- Wind speeds approaching commonly cited operational crosswind limits are rare.
- In January 2025, for example:
- Maximum hourly wind speed: 53 km/h (≈ 28.6 knots)
- Hours at or above 33 knots (≈ 65 km/h): 0
- Most hourly wind speeds fall well below thresholds that would routinely force runway changes.
This is not private or speculative data. It is the same government weather data used across Canada.
For the complete 2025 monthly tables, annual summaries, and downloadable XLSX/PDF files used on this page, see:
👉 Toronto Pearson Surface Wind Data — 2025
This companion page publishes the full ECCC and METAR-derived datasets so residents, municipalities, and regulators can verify the wind context for themselves.
Additional months and full-year summaries will be added as analysis continues.
International Aviation Standards for Measuring Wind
When aviation authorities cite “wind” as a safety justification for runway selection, that claim is grounded in internationally defined aviation and meteorological standards. These standards exist so that wind conditions affecting takeoff and landing can be consistently measured, compared, and independently verified.
Under internationally harmonized standards set by International Civil Aviation Organization (ICAO) and the World Meteorological Organization (WMO):
- Surface wind is the reference wind for runway operations.
- Wind speed and direction are measured using anemometers and wind vanes.
- Sensors are installed at approximately 10 metres (≈33 feet) above ground level.
- Measurements are intended to represent conditions on and immediately above the runway environment.
These standards are used globally and form the basis of aviation weather reporting (e.g., METARs) relied upon by pilots, air traffic control, and regulators.
This is the category of wind data that determines crosswind and tailwind limits during takeoff and landing.
Crosswind Limits and Runway Suitability
Aircraft are certified with defined crosswind and tailwind limits to ensure safe ground handling, directional control, braking, and landing-gear loading. Key points:
- Crosswind limits are assessed using surface wind components at the runway, not winds at altitude.
- Crosswind limits vary by aircraft type and operator procedures, but they are still based on surface wind components at the runway.
- Typical certified crosswind limits for commercial aircraft are on the order of 30–35 knots, depending on aircraft type.
- Limits are reduced when runways are wet, contaminated, or icy.
- These limits apply at the runway, where the aircraft is in contact with the ground.
Real-World Example: How Wind Affects Runway Choice
Wind is not just a single number; its impact depends entirely on how it lines up with the runway. Aviation professionals break it down into headwind and crosswind components to determine whether a runway is within limits.
Here is how that one wind condition affects different runway orientations:
-
Option 1: East–West runway (e.g., Runway 24L/R)
- Most of the wind becomes a headwind, with only a small crosswind component.
- For example, roughly 14 kt headwind and about 5 kt crosswind.
- Status: very comfortable, well below typical crosswind limits.
-
Option 2: North–South runway (e.g., Runway 33L/R)
- The same wind now produces a much larger crosswind and a smaller headwind.
- For example, roughly 5 kt headwind and about 14 kt crosswind.
- Status: still usable, but less favourable and more sensitive to runway condition.
In both cases, these values are far below the 30–35 kt limits typical for large commercial aircraft. The key point is that the decision is about how the surface wind lines up with the runway, not about undisclosed winds at higher altitudes.
“Winds Aloft” — Claim vs Verifiable Facts
| What residents were told at the meeting | What the records and standards show |
|---|---|
| “Winds aloft” data used in runway decisions were described as not published and airline-provided. | Standard winds-aloft forecasts for Toronto Pearson are routinely published in products such as FD/FB and GFA that are used every day for flight planning. |
| “Winds aloft” were presented as information the public could not see or verify. | These forecasts are time-stamped, split into defined altitude bands, and available to aviation users; they are not secret data. |
| “Winds aloft” were used to explain runway choices whenever surface wind data did not match the narrative. | International standards make surface wind at the runway the reference for crosswind and tailwind limits; winds aloft do not replace those measurements. |
| Residents were told aircraft must take off and land into the wind, implying that wind alone determines runway use. | Records show that east–west runways are used more than 95% of the time, far beyond what random wind patterns alone would produce. |
| Concentrated noise over specific neighbourhoods was presented as an unavoidable consequence of wind direction. | Officials have acknowledged that operational efficiency, capacity and layout heavily influence runway choice, meaning residents are experiencing a systematic concentration of traffic, not just neutral wind-driven variation. |
Example: NAV CANADA Operational Display (CYYZ)
NAV CANADA’s NC-AeroView platform displays:
- Winds aloft by altitude band.
- Runway-specific headwind and crosswind components.
- Near-real-time operational wind data for Toronto Pearson.
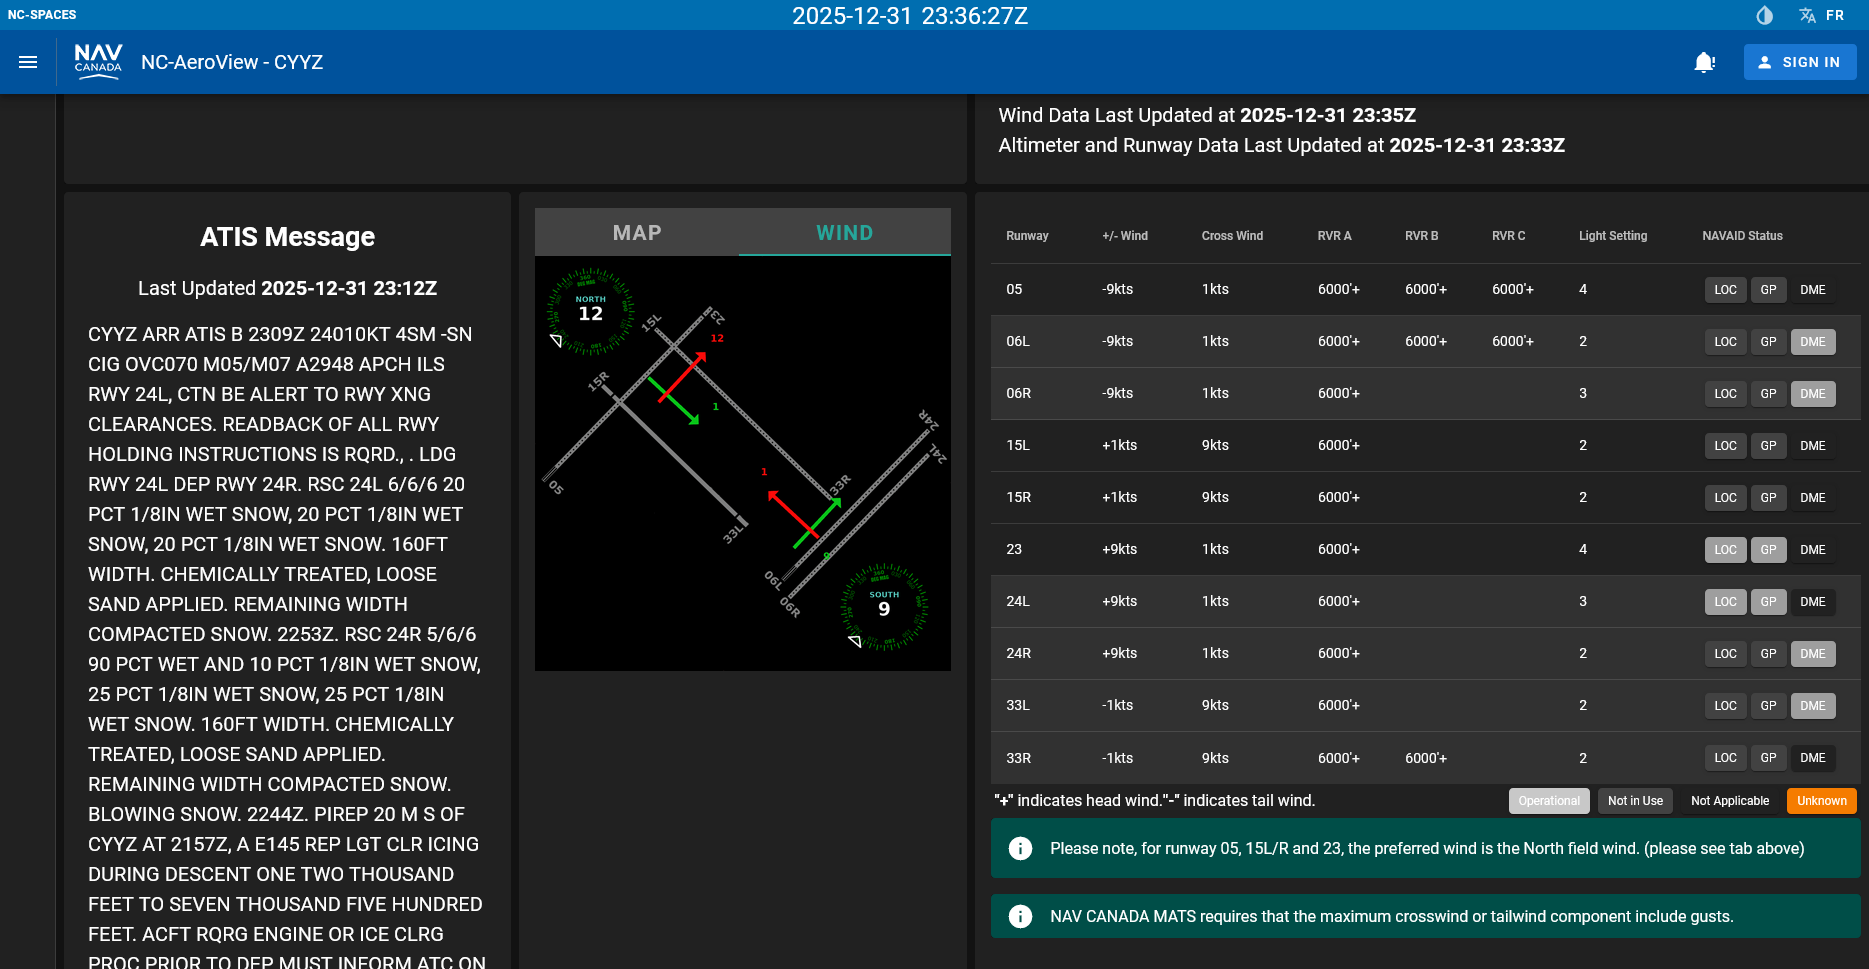
- The left-hand panels show winds by altitude band (winds aloft) used for flight planning.
- The runway panel shows headwind and crosswind components for each active runway, derived from surface wind.
- When the crosswind arrows and values stay well below typical limits (≈30–35 kt), it confirms that capacity and layout — not extreme wind — are usually driving runway choice.
What This Evidence Shows
The record is clear: when residents asked for the wind data that supposedly “forces” Toronto Pearson to concentrate traffic over the same neighbourhoods, the explanation shifted from surface wind to “winds aloft” — and then to the claim that those data could not be shared. Independent checks show that:
- Surface wind at Pearson is measured under a unified international standard (10 metres above ground) used by both ECCC and ICAO/WMO for runway operations.
- Winds aloft are routinely published in standard aviation products used every day for flight planning and are not secret airline data.
- Crosswind limits are based on surface wind at the runway, not on undisclosed winds at higher altitudes.
- East–west runways being used more than 95% of the time reflects an operational choice to maximize capacity and efficiency, not a random consequence of wind.
Together, these facts show that “the wind” is being used as a blanket explanation to defend a pattern of runway use that systematically concentrates noise and pollution over specific communities — even when the official surface wind data do not require it.
- It undermines public trust when verifiable wind standards and datasets are ignored or misrepresented in community meetings.
- It prevents meaningful debate about alternative runway configurations and noise-sharing options that would better protect public health.
- It leaves municipalities, health units, and residents making planning decisions based on narratives instead of independently checkable evidence.
If wind is genuinely being used as a safety constraint, then the data, methods, and thresholds should be transparent, consistent with international standards, and open to independent verification — not hidden behind shifting explanations.
For next steps on how to use this evidence with elected officials, regulators, and health authorities, see our related pages in the Evidence Hub on runway usage, health impacts, and externalized costs.
Pearson Accountability Alliance
Independent Environmental & Public Health Research for Toronto Pearson Communities.