Toronto Pearson Surface Wind Data — 2025
Monthly Records (2025)
TL;DR – What this data shows
- Surface winds at Toronto Pearson were generally moderate throughout 2025.
- Hours with strong winds (≥ 30–35 kt) are relatively rare in both datasets.
- The two independent sources — ECCC hourly climate data and METAR/SPECI operational reports — tell a consistent story.
- All underlying files are published so anyone can independently review and verify the numbers.
Methodology and Regulatory Basis
All surface wind data shown on this page is derived from official ATIS and METAR weather observations for Toronto Pearson International Airport (CYYZ).
Any discussion of runway suitability, wind components, or operational implications is based on the mandatory runway reporting framework prescribed by Transport Canada Advisory Circular AC 300-019, which implements the ICAO Global Reporting Format (GRF) and the Runway Condition Assessment Matrix (RCAM).
Under this framework, runway condition codes and operational assessments are not discretionary; they are determined by applying the RCAM decision logic to observed surface conditions, absent any documented runway downgrade published by the airport operator.
This page replicates that regulatory decision process using officially reported weather data. It does not rely on proprietary airport information, nor does it substitute judgment for required regulatory procedures.
Runway operational decisions (such as crosswind justification) are based on runway-level surface wind components derived from surface wind reports (METAR/ECCC). Winds aloft are not used for runway crosswind/tailwind decisions. Aircraft crosswind limits are determined by surface wind conditions at the aerodrome. This page’s data provide the factual surface wind context against which those operational claims must be evaluated.
Annual Summary of Surface Wind Conditions — 2025
Scope and limitations
These tables present surface wind conditions only. They do not include runway surface condition (RSC) or braking action information, which is recorded and published separately through Runway Surface Condition (RSC) NOTAMs.
To complete the evidentiary record, the Pearson Accountability Alliance formally requested access to the full set of Runway Surface Condition (RSC) NOTAMs, including reported RWYCC/RSC values, for Toronto Pearson International Airport (CYYZ) for the 2025 calendar year.
NAV CANADA has confirmed in writing that it retains all relevant RSC NOTAM and ATIS records in accordance with Transport Canada requirements, but that such records are not disclosed to the public and may only be requested by the Airport Authority or a lawful federal authority using established procedures.
This access restriction and retention confirmation is documented in Exhibit A – NAV CANADA – RSC NOTAM & ATIS archives refusal – Jan 3 2026 (PDF) .
Accordingly, the absence of RSC data in this public record does not reflect a lack of underlying data, but rather restricted access to the authoritative archive.
Any RSC data obtained through authorized channels will be incorporated into this record when available.
In the meantime, the surface-wind distributions shown here provide the publicly verifiable operational context against which claims that 2025 runway configurations were “weather-required” can be independently tested.
Annual Surface Wind Summary — METAR (Operational Observations)
This table summarizes surface wind direction and speed at CYYZ for calendar year 2025 using official METAR observations, which reflect the wind conditions provided directly to pilots and air traffic control for operational decision-making.
| Dataset: METAR / SPECI aviation reports (IEM archive) aggregated to hourly maxima (sustained and gust), Toronto Pearson International Airport | |||||||||
|---|---|---|---|---|---|---|---|---|---|
| year | month name | max sustained kmh | max sustained kt | max gust kmh | max gust kt | Hours ≥ 25 kt (≈ 46 km/h) | Hours ≥ 30 kt (≈ 56 km/h) | Hours ≥ 35 kt (≈ 65 km/h) | Hours with valid wind observations |
| 2025 | January | 54 | 29 | 69 | 37 | 89 | 28 | 5 | 741 |
| 2025 | February | 54 | 29 | 76 | 41 | 50 | 24 | 7 | 672 |
| 2025 | March | 52 | 28 | 72 | 39 | 85 | 37 | 7 | 741 |
| 2025 | April | 69 | 37 | 102 | 55 | 108 | 52 | 12 | 720 |
| 2025 | May | 56 | 30 | 76 | 41 | 35 | 4 | 2 | 744 |
| 2025 | June | 54 | 29 | 76 | 41 | 24 | 9 | 3 | 720 |
| 2025 | July | 50 | 27 | 65 | 35 | 21 | 5 | 1 | 744 |
| 2025 | August | 44 | 24 | 54 | 29 | 9 | 0 | 0 | 744 |
| 2025 | September | 44 | 24 | 67 | 36 | 8 | 5 | 1 | 718 |
| 2025 | October | 54 | 29 | 63 | 34 | 14 | 3 | 0 | 744 |
| 2025 | November | 52 | 28 | 74 | 40 | 86 | 33 | 11 | 720 |
| 2025 | December | 59 | 32 | 78 | 42 | 86 | 41 | 16 | 720 |
→ Download METAR Annual Summary (XLSX)
Derived from official METAR surface wind observations and interpreted in accordance with Transport Canada AC 300-019 RCAM framework, absent any operator-reported runway downgrade.
Annual Surface Wind Summary — ECCC (Independent Climate Record)
This table presents the same annual surface wind distribution using Environment and Climate Change Canada (ECCC) hourly observations. ECCC data provides an independent, climate-grade record used to corroborate operational weather reporting.
| Dataset: Environment & Climate Change Canada (ECCC) hourly climate record (Toronto Pearson International Airport) | |||||||
|---|---|---|---|---|---|---|---|
| year | month name | max sustained kmh | max sustained kt | Hours ≥ 25 kt (≈ 46 km/h) | Hours ≥ 30 kt (≈ 56 km/h) | Hours ≥ 35 kt (≈ 65 km/h) | Hours with valid wind observations |
| 2025 | January | 53 | 28.6 | 5 | 0 | 0 | 744 |
| 2025 | February | 53 | 28.6 | 7 | 0 | 0 | 672 |
| 2025 | March | 52 | 28.1 | 9 | 0 | 0 | 744 |
| 2025 | April | 53 | 28.6 | 18 | 0 | 0 | 720 |
| 2025 | May | 45 | 24.3 | 0 | 0 | 0 | 744 |
| 2025 | June | 53 | 28.6 | 3 | 0 | 0 | 720 |
| 2025 | July | 49 | 26.5 | 1 | 0 | 0 | 744 |
| 2025 | August | 44 | 23.8 | 0 | 0 | 0 | 743 |
| 2025 | September | 44 | 23.8 | 0 | 0 | 0 | 720 |
| 2025 | October | 54 | 29.2 | 1 | 0 | 0 | 744 |
| 2025 | November | 52 | 28.1 | 10 | 0 | 0 | 720 |
| 2025 | December | 58 | 31.3 | 14 | 2 | 0 | 744 |
→ Download ECCC Annual Summary (XLSX)
ECCC climate observations are independent of airport operational reporting and are included to corroborate METAR-based surface wind distributions.
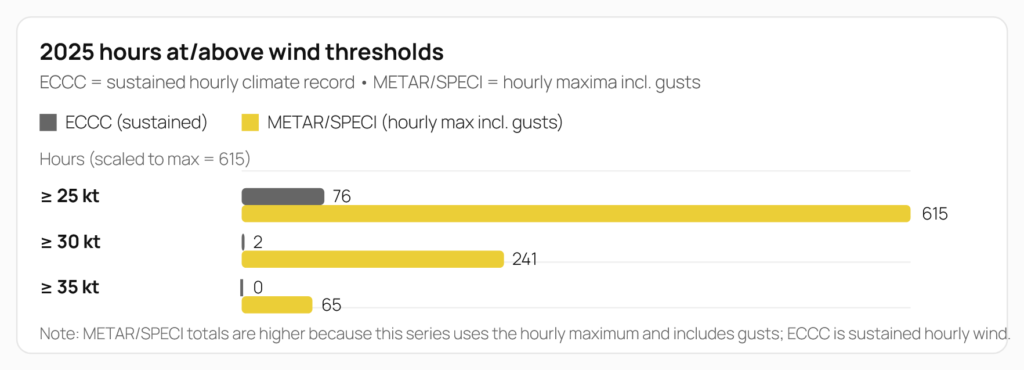
Annual Summary (2025)
Two full-year summaries are provided: (1) the official hourly climate record (ECCC), and (2) METAR/SPECI operational reports aggregated to hourly maxima (includes gusts).
Readers are encouraged to compare this data with public statements regarding runway use and wind justification.
How to read the annual summary tables
- max_sustained_kmh / max_sustained_kt: the highest hourly wind speed observed that month (converted between km/h and knots).
- Hours ≥ 25 / 30 / 35 kt: number of hours in the month where wind met or exceeded each threshold (≥).
- Hours with valid wind observations: how many hours actually had wind data available for counting.
-
METAR vs ECCC difference:
- ECCC is the official hourly climate station record.
- METAR is operational aviation reporting; the monthly file is aggregated to hourly values using the maximum wind reported within each hour, and may include gusts (shown in max_gust columns).
METAR / SPECI (Hourly Max incl Gust)
This table shows aggregated wind conditions based on METAR and SPECI aviation weather reports.
Wind values are reported in knots, and gusts (where present) are included in the hourly maximum.
- max_sustained_kmh / max_sustained_kt: highest sustained wind reported in the month
- max_gust_kmh / max_gust_kt: highest gust reported in the month
- Hours ≥ 25 / 30 / 35 kt: number of hours where wind met or exceeded each threshold (≥)
- Hours with valid wind observations: number of hours with usable data
- → ECCC (Hourly Climate Record) — Annual Summary (XLSX)
- → METAR/SPECI (Hourly Max incl Gust) — Annual Summary (XLSX)
Click on chart to enlarge
Purpose of This Page
This page publishes official monthly surface wind data for Toronto Pearson Airport, drawn from the federal weather station operated under Environment & Climate Change Canada standards.
The purpose is simple:
- To provide verifiable wind data referenced in discussions about runway selection
- To allow the public to independently assess claims that “wind” necessitates persistent runway configurations
- To maintain a transparent, primary data record separate from narrative or analysis
Interpretation and policy discussion are addressed elsewhere (see → The Wind Myth).
Data Sources and Measurement Standards
All data published on this page originate from official government and aviation weather sources, and are presented in two parallel datasets for transparency.
METAR data reflects what pilots see operationally in the cockpit; ECCC data provides an independent climate-grade record. Their agreement strengthens confidence in the findings.
Primary Dataset — Hourly Surface Wind (Climate Record)
- Source: Environment & Climate Change Canada (ECCC)
- Station: Toronto Pearson International Airport
- Observation type: Hourly surface wind observations
Key measurement characteristics:
- Wind measured using anemometers
- Sensor height approximately 10 metres (≈33 feet) above ground level
- Units reported in km/h
- Represents sustained surface wind conditions relevant to takeoff and landing
These are the standardized surface wind observations used nationally and internationally for climate and environmental reporting.
Supplementary Dataset — METAR Wind and Gust Reports (Operational)
In addition, this page publishes derived summaries based on METAR and SPECI aviation weather reports for Toronto Pearson Airport.
Key characteristics of METAR data:
- Wind reported in knots, consistent with aviation practice
- May include wind gusts, indicated by “GxxKT”
- Reports may occur more frequently than once per hour
To allow comparison with hourly climate data, METAR observations are aggregated to hourly values, using the maximum reported wind within each hour, whether sustained or gust.
METAR-derived files are clearly labeled and published as supplementary operational context, not as a replacement for the official climate record.
Both datasets independently describe the same underlying surface wind environment at Toronto Pearson Airport and lead to consistent conclusions regarding the frequency and magnitude of strong surface winds.
Why “winds aloft” aren’t the crosswind/tailwind basis
Why “winds aloft” are not used for crosswind or tailwind assessment
Crosswind and tailwind components used for runway suitability are computed from surface wind at the aerodrome, i.e., the wind reported for the runway environment.
Winds aloft may be relevant to other hazards such as turbulence or wind shear, but they are not the standard input for calculating runway crosswind or tailwind components under international aviation practice.
Runway crosswind and tailwind limits are based on surface wind.
Under international aviation practice, runway suitability is assessed using wind measured at the aerodrome for the runway environment. Winds aloft may be relevant to other hazards (such as turbulence or wind shear), but they are not the standard input for calculating takeoff or landing crosswind or tailwind limits.
(Consistent with ICAO Annex 14 / standard aircraft flight manual performance practice.)
Methodology
For each month:
- Hourly surface wind records are compiled from official sources
-
Summary statistics are calculated, including:
- Maximum observed surface wind speed
- Distribution of hourly wind values
- Number of hours exceeding selected reference thresholds
- No smoothing, modelling, or extrapolation is applied
For METAR data:
- Multiple observations within an hour are aggregated
- The maximum sustained or gust wind reported within each hour is used
- This produces a conservative, gust-inclusive hourly value
Raw data are preserved and made available alongside derived summaries.
Aircraft Categories and Reference Thresholds
Reference thresholds used on this page (transparency only)
Airports do not publish a single universal “crosswind limit” because crosswind/tailwind limitations are
aircraft- and operator-specific (AFM / airline SOPs). However, maximum demonstrated or
operational crosswind references commonly fall into broad ranges (depending on aircraft type, runway condition,
procedures, and operator policy). SKYbrary
To keep this page transparent (and resilient to challenges), the summaries report the number of hours where sustained wind speed meets or exceeds:
- ≥ 25 kt (≈ 46 km/h) — conservative / regional reference
- ≥ 30 kt (≈ 56 km/h) — mid-range reference
- ≥ 35 kt (≈ 65 km/h) — upper demonstrated reference
These thresholds are not claims about any specific airline’s limits—they are published solely so readers can evaluate wind frequency against commonly discussed operational ranges.
These values correspond to commonly cited maximum demonstrated crosswind references published in Aircraft Flight Manuals and related operational guidance.
Both sustained wind (climate record) and gust-inclusive wind (METAR) are evaluated against the same reference thresholds for consistency.
Monthly Wind Data — 2025 (ECCC)
Wind components are calculated from surface wind; RCAM is referenced only for runway-condition reporting context.
January 2025
--------------------------------------------------------
Maximum hourly sustained wind speed: 53 km/h (≈ 28.6 kt)
--------------------------------------------------------

Hours ≥ 25 kt (≈ 46 km/h): 7
Hours ≥ 30 kt (≈ 56 km/h): 0
Hours ≥ 35 kt (≈ 65 km/h): 0
-> View / Download January 2025 Data (XLSX)
-> View / Download January 2025 Data (PDF)
February 2025
--------------------------------------------------------
Maximum hourly sustained wind speed: 53 km/h (≈ 28.6 kt)
--------------------------------------------------------

Hours ≥ 25 kt (≈ 46 km/h): 9
Hours ≥ 30 kt (≈ 56 km/h): 0
Hours ≥ 35 kt (≈ 65 km/h): 0
-> View / Download February 2025 Data (XLSX)
-> View / Download February 2025 Data (PDF)
March 2025
--------------------------------------------------------
Maximum hourly sustained wind speed: 52 km/h (≈ 28.1 kt)
--------------------------------------------------------

Hours ≥ 25 kt (≈ 46 km/h): 9
Hours ≥ 30 kt (≈ 56 km/h): 0
Hours ≥ 35 kt (≈ 65 km/h): 0
-> View / Download March 2025 Data (XLSX)
-> View / Download March 2025 Data (PDF)
April 2025
--------------------------------------------------------
Maximum hourly sustained wind speed: 53 km/h (≈ 28.6 kt)
--------------------------------------------------------

Hours ≥ 25 kt (≈ 46 km/h): 21
Hours ≥ 30 kt (≈ 56 km/h): 0
Hours ≥ 35 kt (≈ 65 km/h): 0
-> View / Download April 2025 Data (XLSX)
-> View / Download April 2025 Data (PDF)
May 2025
--------------------------------------------------------
Maximum hourly sustained wind speed: 45 km/h (≈ 24.3 kt)
--------------------------------------------------------

Hours ≥ 25 kt (≈ 46 km/h): 0
Hours ≥ 30 kt (≈ 56 km/h): 0
Hours ≥ 35 kt (≈ 65 km/h): 0
-> View / Download May 2025 Data (XLSX)
-> View / Download May 2025 Data (PDF)
June 2025
--------------------------------------------------------
Maximum hourly sustained wind speed: 53 km/h (≈ 28.6 kt)
--------------------------------------------------------

Hours ≥ 25 kt (≈ 46 km/h): 3
Hours ≥ 30 kt (≈ 56 km/h): 0
Hours ≥ 35 kt (≈ 65 km/h): 0
-> View / Download June 2025 Data (XLSX)
-> View / Download June 2025 Data (PDF)
July 2025
--------------------------------------------------------
Maximum hourly sustained wind speed: 49 km/h (≈ 26.5 kt)
--------------------------------------------------------

Hours ≥ 25 kt (≈ 46 km/h): 1
Hours ≥ 30 kt (≈ 56 km/h): 0
Hours ≥ 35 kt (≈ 65 km/h): 0
-> View / Download July 2025 Data (XLSX)
-> View / Download July 2025 Data (PDF)
August 2025
--------------------------------------------------------
Maximum hourly sustained wind speed: 44 km/h (≈ 23.8 kt)
--------------------------------------------------------

Hours ≥ 25 kt (≈ 46 km/h): 0
Hours ≥ 30 kt (≈ 56 km/h): 0
Hours ≥ 35 kt (≈ 65 km/h): 0
-> View / Download August 2025 Data (XLSX)
-> View / Download August 2025 Data (PDF)
September 2025
--------------------------------------------------------
Maximum hourly sustained wind speed: 44 km/h (≈ 23.8 kt)
--------------------------------------------------------

Hours ≥ 25 kt (≈ 46 km/h): 0
Hours ≥ 30 kt (≈ 56 km/h): 0
Hours ≥ 35 kt (≈ 65 km/h): 0
-> View / Download September 2025 Data (XLSX)
-> View / Download September 2025 Data (PDF)
October 2025
--------------------------------------------------------
Maximum hourly sustained wind speed: 54 km/h (≈ 29.2 kt)
--------------------------------------------------------

Hours ≥ 25 kt (≈ 46 km/h): 1
Hours ≥ 30 kt (≈ 56 km/h): 0
Hours ≥ 35 kt (≈ 65 km/h): 0
-> View / Download October 2025 Data (XLSX)
-> View / Download October 2025 Data (PDF)
November 2025
--------------------------------------------------------
Maximum hourly sustained wind speed: 52 km/h (≈ 28.1 kt)
--------------------------------------------------------

Hours ≥ 25 kt (≈ 46 km/h): 10
Hours ≥ 30 kt (≈ 56 km/h): 0
Hours ≥ 35 kt (≈ 65 km/h): 0
-> View / Download November 2025 Data (XLSX)
-> View / Download November 2025 Data (PDF)
December 2025
--------------------------------------------------------
Maximum hourly sustained wind speed: 58 km/h (≈ 31.3 kt)
--------------------------------------------------------

Hours ≥ 25 kt (≈ 46 km/h): 15
Hours ≥ 30 kt (≈ 56 km/h): 2
Hours ≥ 35 kt (≈ 65 km/h): 0
-> View / Download December 2025 Data (XLSX)
-> View / Download December 2025 Data (PDF)
METAR source and what “gusts” mean
METAR and SPECI data for Toronto Pearson Airport were downloaded from the Iowa State University – Iowa Environmental Mesonet (IEM) METAR archive, which provides long-term, publicly accessible archives of operational aviation weather reports.
Measurement standard (surface wind)
Both datasets represent near-surface aerodrome wind, typically measured to represent winds at ~10 m above ground and reported for operational aviation use (direction/speed and gusts when applicable).
Source Files
How to read this table (METAR raw file)
How to read the raw METAR XLSX
- Each row is a METAR or SPECI report.
- “Gxx” indicates a gust (e.g.,
27015G25KT= wind 270° at 15 kt gusting 25 kt). - Your monthly/annual METAR summaries aggregate this raw feed to hourly maxima (sustained or gust), so readers can compare hour-to-hour with ECCC.
→ METAR / SPECI Source Files (Iowa State IEM Archive) (Source)
→ View / Download METAR Raw Extract (IEM) (XLSX)
Raw METAR/SPECI reports as downloaded from the Iowa State University IEM archive. No edits; used only as input to generate hourly aggregates shown below.
January–December 2025 (METAR / SPECI, includes gusts)
Wind components calculated from official ATIS/METAR data and interpreted in accordance with Transport Canada AC 300-019 (RCAM), absent any operator-reported runway downgrade
January 2025
----------------------------------------------------------
Maximum hourly wind speed (sustained): 54 km/h (≈ 29.0 kt)
Maximum hourly wind gust: 69 km/h (≈ 37.0 kt)
----------------------------------------------------------

Hours ≥ 25 kt (≈ 46 km/h): 89
Hours ≥ 30 kt (≈ 56 km/h): 28
Hours ≥ 35 kt (≈ 65 km/h): 5
→ View / Download January 2025 Data (XLSX)
→ View / Download January 2025 Data (PDF)
February 2025
----------------------------------------------------------
Maximum hourly wind speed (sustained): 54 km/h (≈ 29.0 kt)
Maximum hourly wind gust: 76 km/h (≈ 41.0 kt)
----------------------------------------------------------

Hours ≥ 25 kt (≈ 46 km/h): 50
Hours ≥ 30 kt (≈ 56 km/h): 24
Hours ≥ 35 kt (≈ 65 km/h): 7
→ View / Download February 2025 Data (XLSX)
→ View / Download February 2025 Data (PDF)
March 2025
----------------------------------------------------------
Maximum hourly wind speed (sustained): 52 km/h (≈ 28.0 kt)
Maximum hourly wind gust: 72 km/h (≈ 39.0 kt)
----------------------------------------------------------

Hours ≥ 25 kt (≈ 46 km/h): 85
Hours ≥ 30 kt (≈ 56 km/h): 37
Hours ≥ 35 kt (≈ 65 km/h): 7
→ View / Download March 2025 Data (XLSX)
→ View / Download March 2025 Data (PDF)
April 2025
----------------------------------------------------------
Maximum hourly wind speed (sustained): 69 km/h (≈ 37.0 kt)
Maximum hourly wind gust: 102 km/h (≈ 55.0 kt)
----------------------------------------------------------

Hours ≥ 25 kt (≈ 46 km/h): 108
Hours ≥ 30 kt (≈ 56 km/h): 52
Hours ≥ 35 kt (≈ 65 km/h): 12
→ View / Download April 2025 Data (XLSX)
→ View / Download April 2025 Data (PDF)
May 2025
----------------------------------------------------------
Maximum hourly wind speed (sustained): 56 km/h (≈ 30.0 kt)
Maximum hourly wind gust: 76 km/h (≈ 41.0 kt)
----------------------------------------------------------

Hours ≥ 25 kt (≈ 46 km/h): 35
Hours ≥ 30 kt (≈ 56 km/h): 4
Hours ≥ 35 kt (≈ 65 km/h): 2
→ View / Download May 2025 Data (XLSX)
→ View / Download May 2025 Data (PDF)
June 2025
----------------------------------------------------------
Maximum hourly wind speed (sustained): 54 km/h (≈ 29.0 kt)
Maximum hourly wind gust: 76 km/h (≈ 41.0 kt)
----------------------------------------------------------

Hours ≥ 25 kt (≈ 46 km/h): 24
Hours ≥ 30 kt (≈ 56 km/h): 9
Hours ≥ 35 kt (≈ 65 km/h): 3
→ View / Download June 2025 Data (XLSX)
→ View / Download June 2025 Data (PDF)
July 2025
----------------------------------------------------------
Maximum hourly wind speed (sustained): 50 km/h (≈ 27.0 kt)
Maximum hourly wind gust: 65 km/h (≈ 35.0 kt)
----------------------------------------------------------

Hours ≥ 25 kt (≈ 46 km/h): 21
Hours ≥ 30 kt (≈ 56 km/h): 5
Hours ≥ 35 kt (≈ 65 km/h): 1
→ View / Download July 2025 Data (XLSX)
→ View / Download July 2025 Data (PDF)
August 2025
----------------------------------------------------------
Maximum hourly wind speed (sustained): 44 km/h (≈ 24.0 kt)
Maximum hourly wind gust: 54 km/h (≈ 29.0 kt)
----------------------------------------------------------

Hours ≥ 25 kt (≈ 46 km/h): 9
Hours ≥ 30 kt (≈ 56 km/h): 0
Hours ≥ 35 kt (≈ 65 km/h): 0
→ View / Download August 2025 Data (XLSX)
→ View / Download August 2025 Data (PDF)
September 2025
----------------------------------------------------------
Maximum hourly wind speed (sustained): 44 km/h (≈ 24.0 kt)
Maximum hourly wind gust: 67 km/h (≈ 36.0 kt)
----------------------------------------------------------

Hours ≥ 25 kt (≈ 46 km/h): 8
Hours ≥ 30 kt (≈ 56 km/h): 5
Hours ≥ 35 kt (≈ 65 km/h): 1
→ View / Download September 2025 Data (XLSX)
→ View / Download September 2025 Data (PDF)
October 2025
----------------------------------------------------------
Maximum hourly wind speed (sustained): 54 km/h (≈ 29.0 kt)
Maximum hourly wind gust: 63 km/h (≈ 34.0 kt)
----------------------------------------------------------

Hours ≥ 25 kt (≈ 46 km/h): 14
Hours ≥ 30 kt (≈ 56 km/h): 3
Hours ≥ 35 kt (≈ 65 km/h): 0
→ View / Download October 2025 Data (XLSX)
→ View / Download October 2025 Data (PDF)
November 2025
----------------------------------------------------------
Maximum hourly wind speed (sustained): 52 km/h (≈ 28.0 kt)
Maximum hourly wind gust: 74 km/h (≈ 40.0 kt)
----------------------------------------------------------

Hours ≥ 25 kt (≈ 46 km/h): 86
Hours ≥ 30 kt (≈ 56 km/h): 33
Hours ≥ 35 kt (≈ 65 km/h): 11
→ View / Download November 2025 Data (XLSX)
→ View / Download November 2025 Data (PDF)
December 2025
----------------------------------------------------------
Maximum hourly wind speed (sustained): 59 km/h (≈ 32.0 kt)
Maximum hourly wind gust: 78 km/h (≈ 42.0 kt)
----------------------------------------------------------

Hours ≥ 25 kt (≈ 46 km/h): 86
Hours ≥ 30 kt (≈ 56 km/h): 41
Hours ≥ 35 kt (≈ 65 km/h): 16
→ View / Download December 2025 Data (XLSX)
→ View / Download December 2025 Data (PDF)
Related Pages
- → The Wind Myth — analysis and accountability context
- → Humber River–Black Creek Community Meeting — Minutes & Transcript (Sept 4, 2025)
Data Integrity Statement
All datasets are published as received from official government sources or derived directly from those datasets using disclosed methods. No data have been altered, filtered, or selectively removed.
Pearson Accountability Alliance
Independent Environmental & Public Health Research for Toronto Pearson Communities.